If you’re reading Head First JavaScript Programming or Head First HTML5 Programming, this is where you’ll find instructions on how to use the console in modern browsers to examine your console.log output and check for errors, like we show you in the examples in the book.
With every browser, you’ll use a slightly different way of accessing and using the developer console. Not only that, but the browsers change the implementation of the console occasionally. For instance, Safari version 6.1 has a very different looking console from Safari version 6. So be prepared to experiment a little if your console doesn’t look exactly like the examples below (although we’ll do our best to keep this information up to date with the most recent version of each browser).
To show you how to access the console in each browser, I’m using an example from Chapter 1, in the file howdy.html. You can download all the code from github, or type the example in from the book.
I’ll first cover browsers on the Mac, and after that, browsers on Windows. I’ll show you Chrome, Safari and Firefox on the Mac; and Chrome, Firefox and IE on Windows.
Once you’ve got the basics down of how to access the developer console in your browser, check out the video I created that shows you more about how to use the console: Head First JavaScript Programming: Experimenting with JavaScript in the Console.
Related Videos
Using the Console: Two videos about using the Safari and Chrome consoles.
Head First JavaScript Programming: Experimenting with JavaScript in the Console: How to use the JavaScript console to experiment with and test your JavaScript code.
Chrome (Mac)
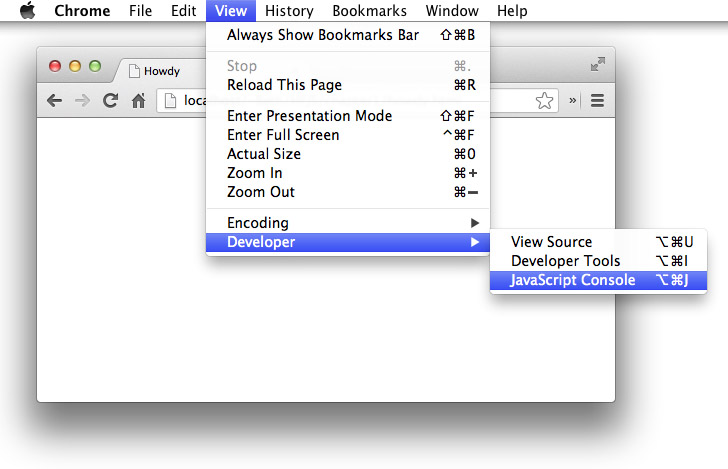
To access the developer console in Chrome, first load the howdy.html file into your browser, and then use the View > Developer > JavaScript Console menu (Option-Cmd-J):
The Console will open at the bottom of your browser window, and you should see the message “Howdy partner” displayed:
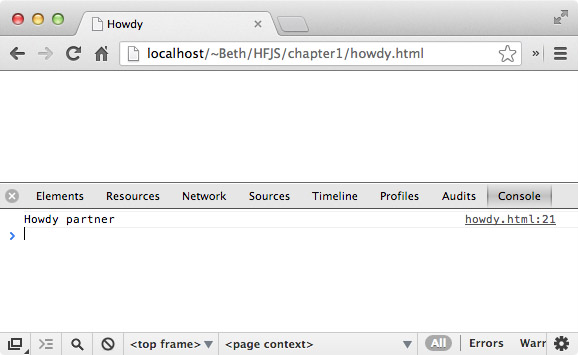
If you don’t see “Howdy partner”, just reload the page. This is where you’ll see any messages you pass to console.log in your JavaScript programs. It’s also where you’ll see errors, if your program has any, so it’s a good idea to open the console when you’re working on a program so you can see any errors that pop up.
You can change the size of the console by placing your mouse over the line above the tabs (you’ll see the mouse cursor change to the sizing cursor), and moving the top of the console up or down.
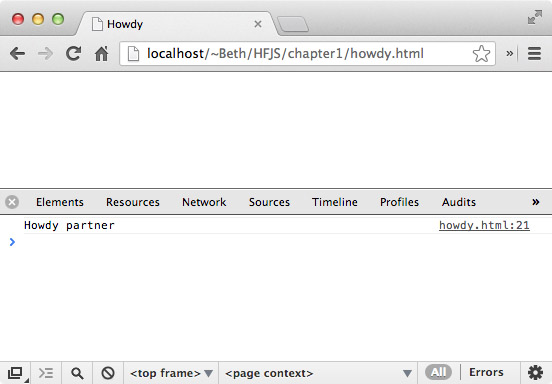
If you don’t see the Console tab on the right:
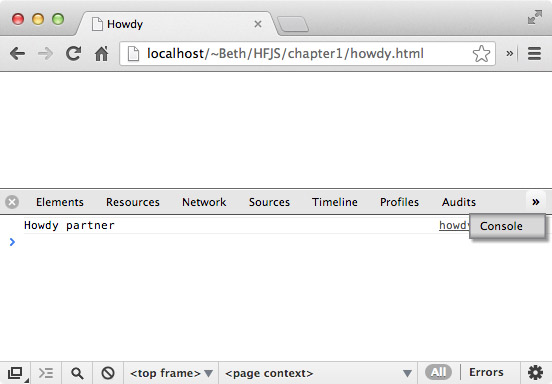
and you need to get back to the Console from another tab, you can use the little popup menu under the two little right arrows (>>) on the right side of the tab bar:
To close the console window, use the X in the top left corner of the console. This will not close your browser window, just the console.
Safari (Mac)
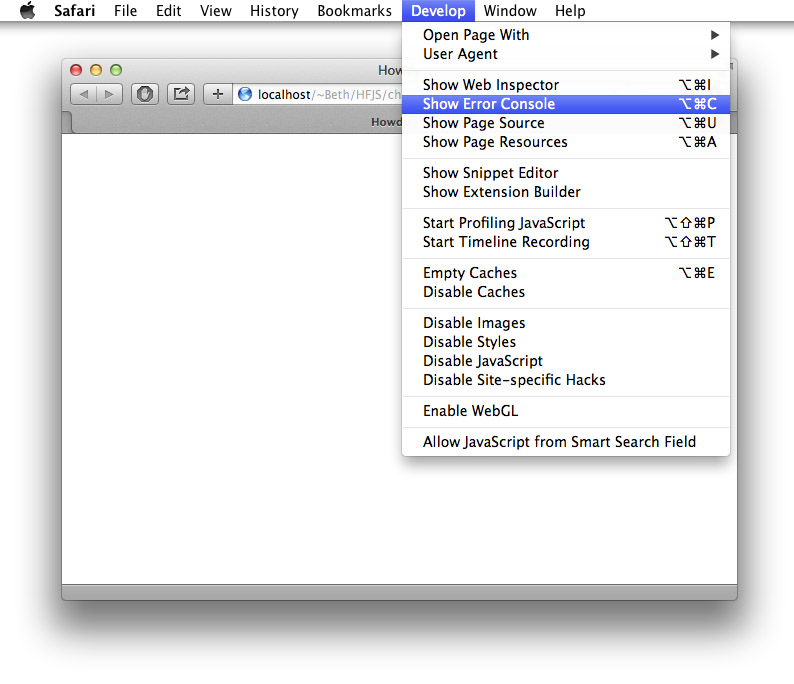
To access the developer console in Safari, use the Develop > Show Error Console menu item (Option-Cmd-C):
If you don’t see the Develop menu, you’ll need to turn it on using Safari Preferences. Open Safari > Preferences, and click on the Advanced Tab. At the bottom of the pane, check the box next to “Show Develop Menu in menu bar”:
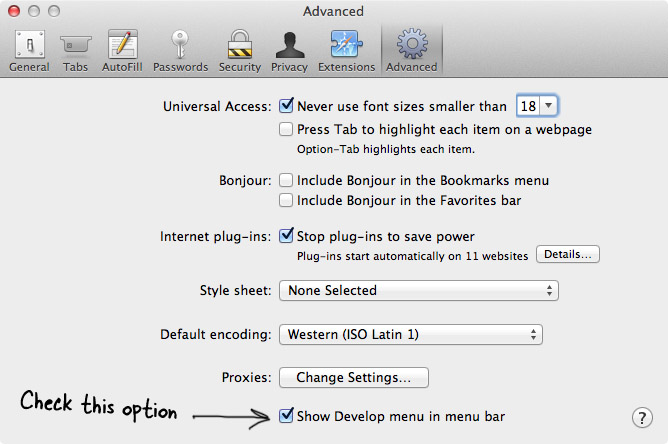
The Develop menu will appear and you’ll be able to access the Show Error Console menu item.
If your browser window is small when you open the console, you may see the console open into a completely separate window. It’s fine to leave it as a separate window; however, if you want the console to appear in the same window as your page (as shown here), then try closing the console, making your browser window bigger, and then using the menu to open the console again.
If you’ve already loaded howdy.html into the browser, you should see “Howdy partner” displayed in the console.
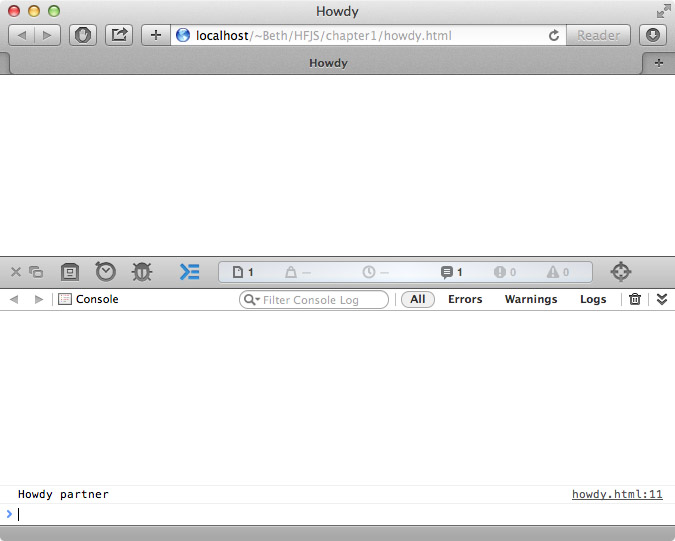
If you don’t see “Howdy partner”, go ahead and load the page (or reload it), and you should see the message appear.
This console is where you’ll see any messages you pass to console.log in your JavaScript programs. It’s also where you’ll see errors, if your program has any, so it’s a good idea to open the console when you’re working on a program so you can see any errors that pop up.
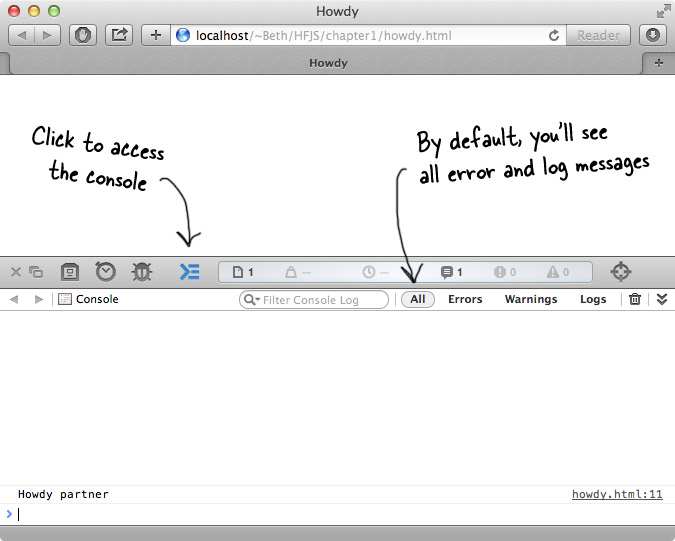
Notice that you have a choice of viewing “All” console messages, or just errors or log messages. Typically, you’ll want to leave “All” selected so you can see everything.
Also, if you try clicking the other buttons, and you lose the console, you can always get back to it by clicking the console button (shown below):
Firefox (Mac)
To access the developer console in Firefox, use the Tools > Web Developer > Web Console menu item (Option-Cmd-K):
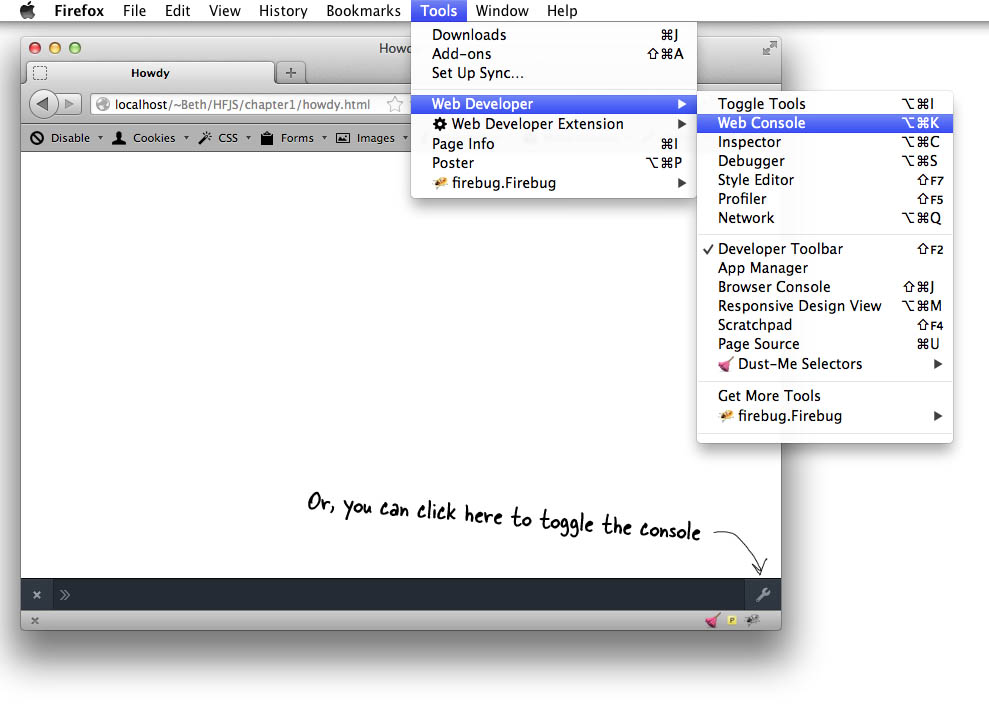
You’ll see the console appear in the bottom part of your browser window (unless you have an older version of Firefox, in which case it might open in the top part of the window). You can also toggle the little wrench in the bottom right corner to show/hide the console.
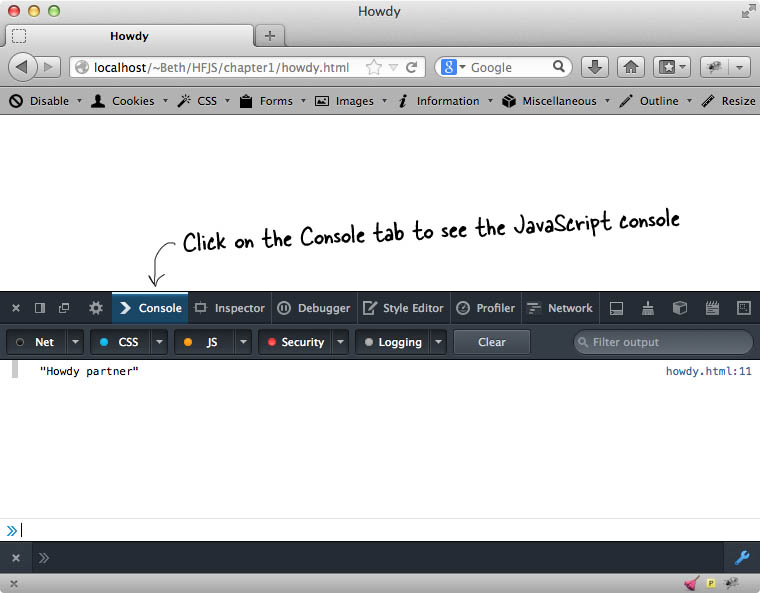
If you don’t see the console.log output, go ahead and reload the page, and then you should see “Howdy partner” displayed at the top of the console.
This console is where you’ll see any messages you pass to console.log in your JavaScript programs. It’s also where you’ll see errors, if your program has any, so it’s a good idea to open the console when you’re working on a program so you can see any errors that pop up.
Chrome (Windows)
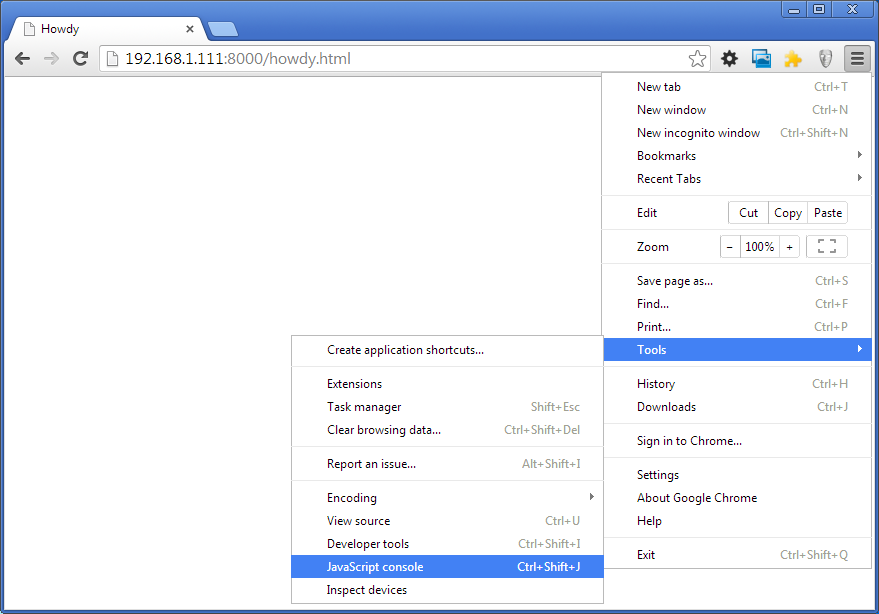
To access the developer console in Chrome on Windows, use the menu on the right of the window, and choose Tools > JavaScript console:
You’ll see the console appear in the bottom part of the screen, and you should see the output from the page, howdy.html, appear in the console. If you don’t, just reload the page to see it.
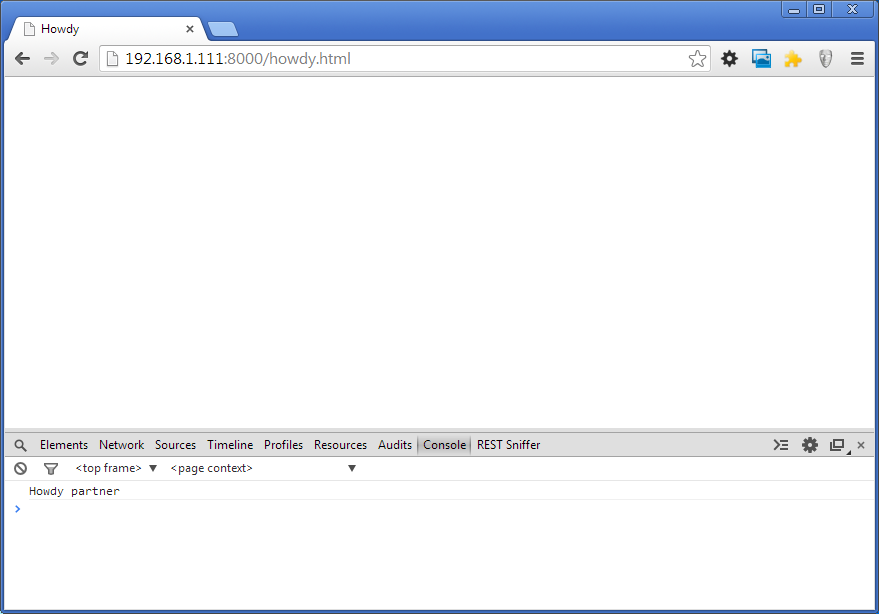
Make sure you’ve selected the “Console” tab as shown above.
Firefox (Windows)
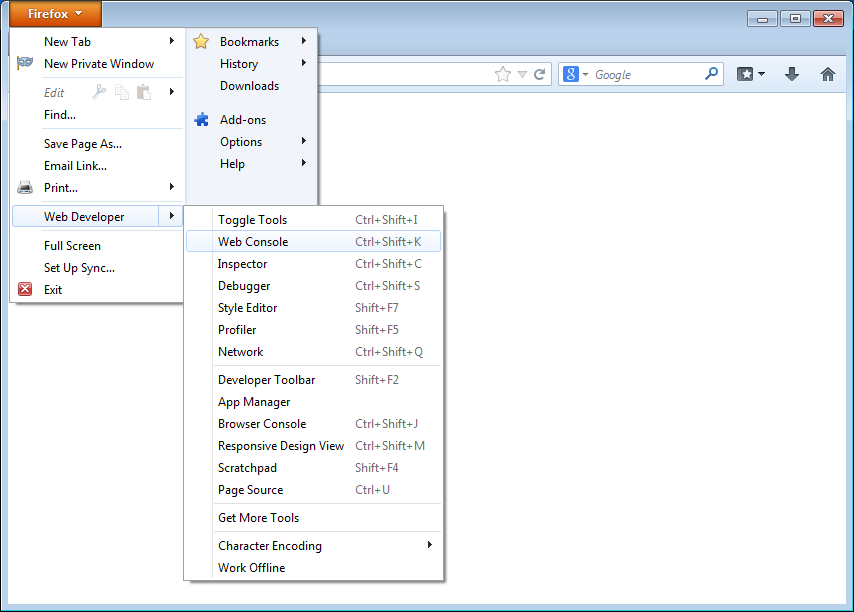
To access the developer console in Firefox on Windows, use the main menu and choose Web Developer > Web Console:
You’ll see the console appear in the bottom part of the screen, and you should see the output from the page, howdy.html, appear in the console. If you don’t, just reload the page to see it.
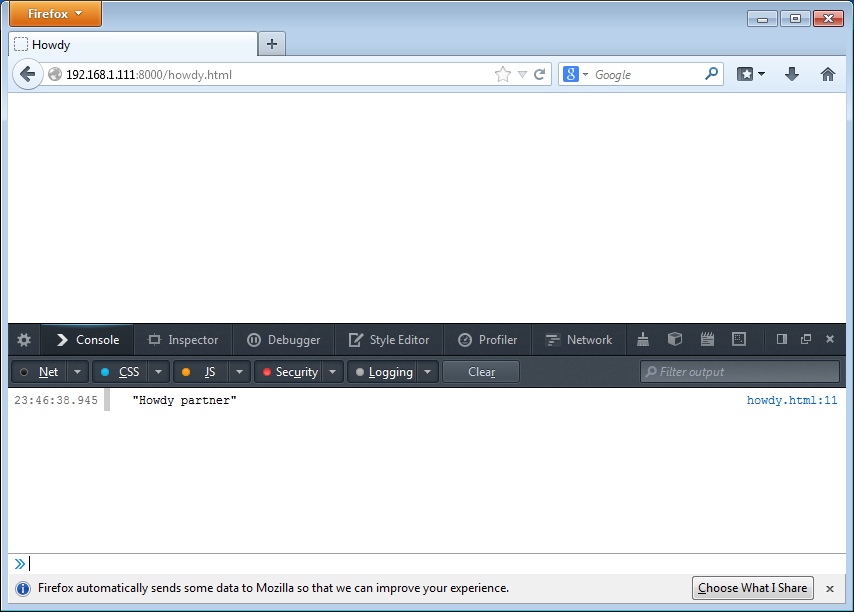
Make sure you’ve selected the “Console” tab as shown above.
Internet Explorer (Windows 7)
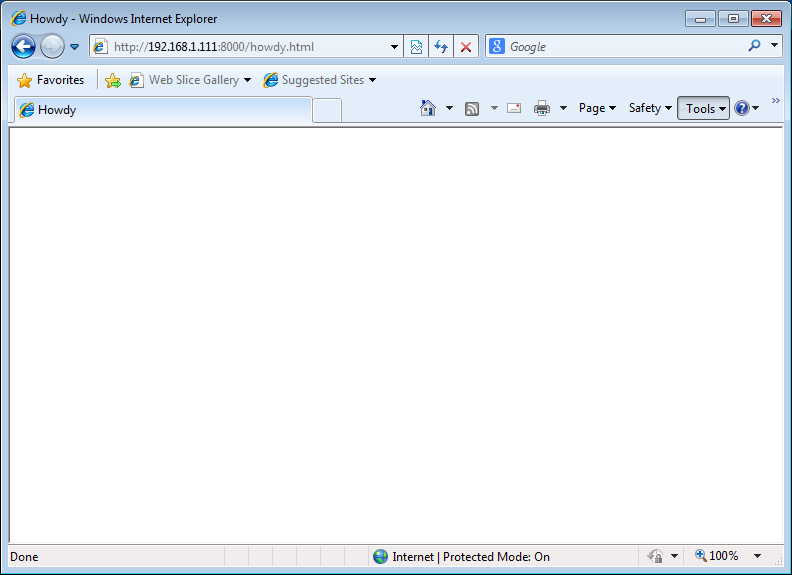
To access the console in IE (on Windows 7), use the F12 Developer Tools option under the Tools menu:
When the tools opens, you’ll see that by default, you’re probably in the HTML tab. To see the JavaScript console, click on the Script tab:
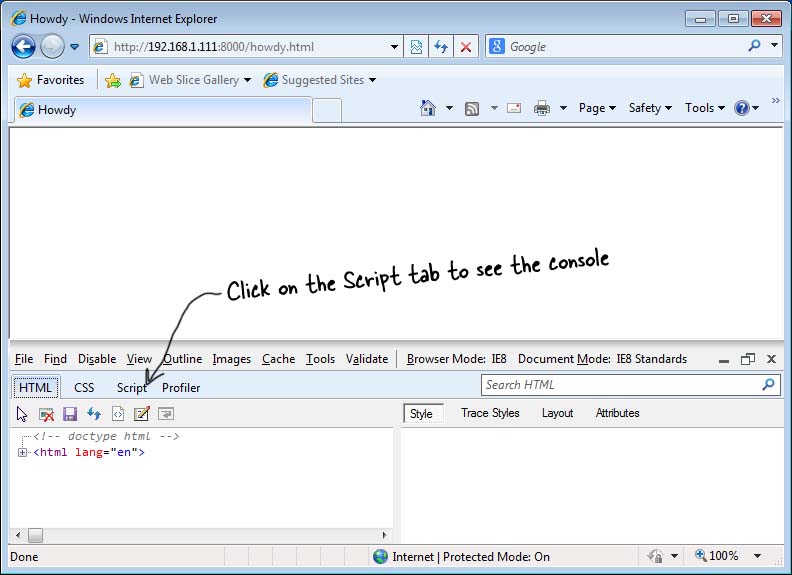
When the console opens, you should see the output from the howdy.html file in the console; if you don’t, just reload the page.

Internet Explorer (Windows 8)
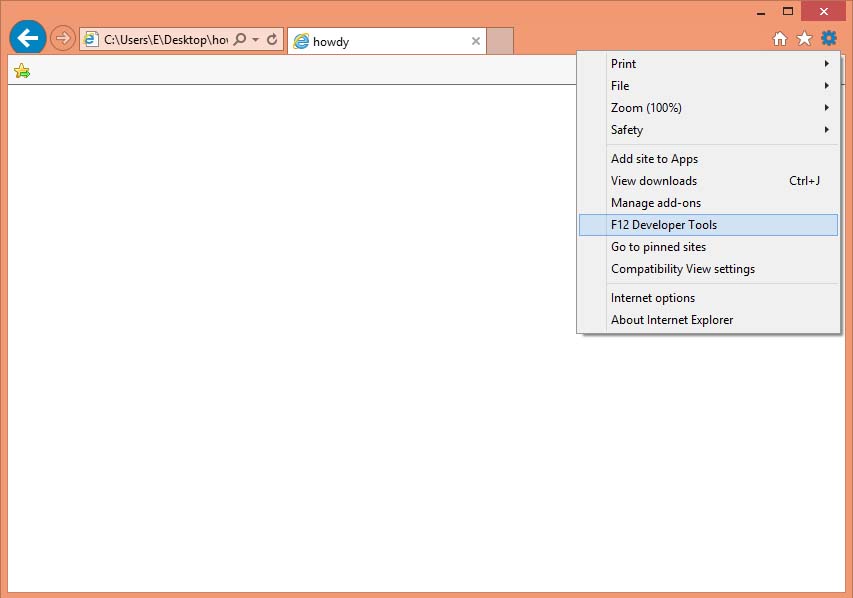
To access the console in IE (Windows 8), use the Tools menu (looks like a cog), and choose F12 Developer Tools:
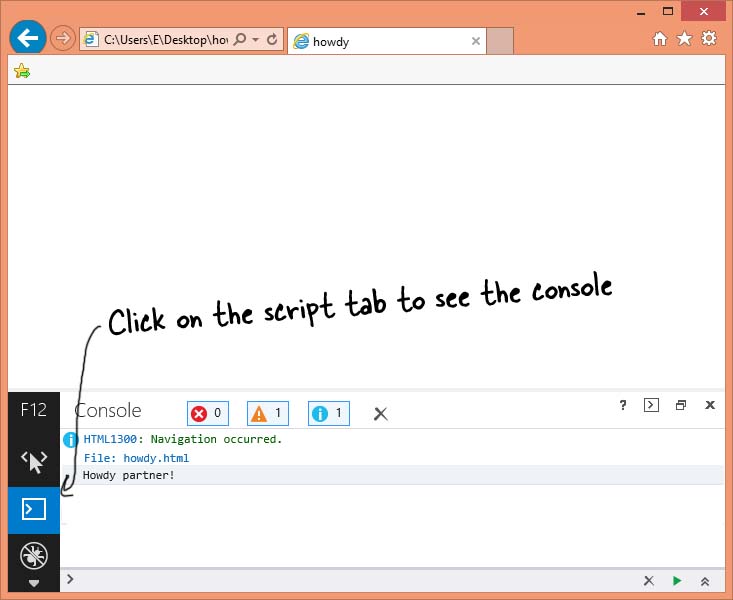
Like in Windows 7, you’ll probably initially see the HTML view; just click on the script tab (a box with a > in it) to see the JavaScript console:

Comments